Trend based trading in Bitcoin
Bitcoin has trends where it moves similarly. While inside a trend, the direction, volatility, reversals, and response to various stimuli are similar. The scope of similarity is different in longer and shorter timelines. I establish a simple and replicable method for dividing trends in this post. Then I do a couple of backtests to provide credence to my initial claim and, in doing so, provide trading strategies. Github codes in this analysis here
Trend Calculation
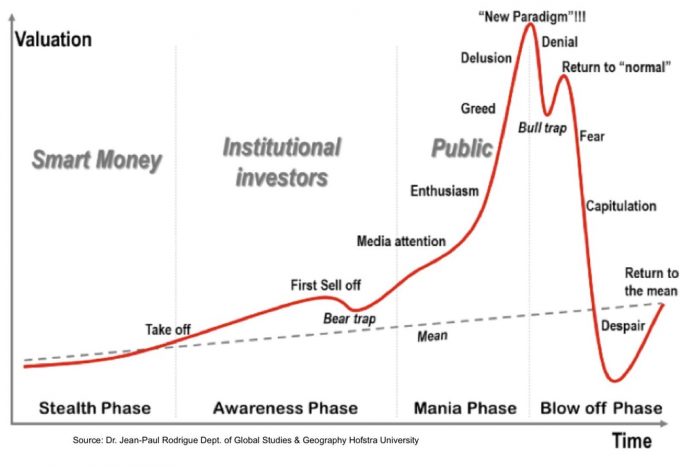
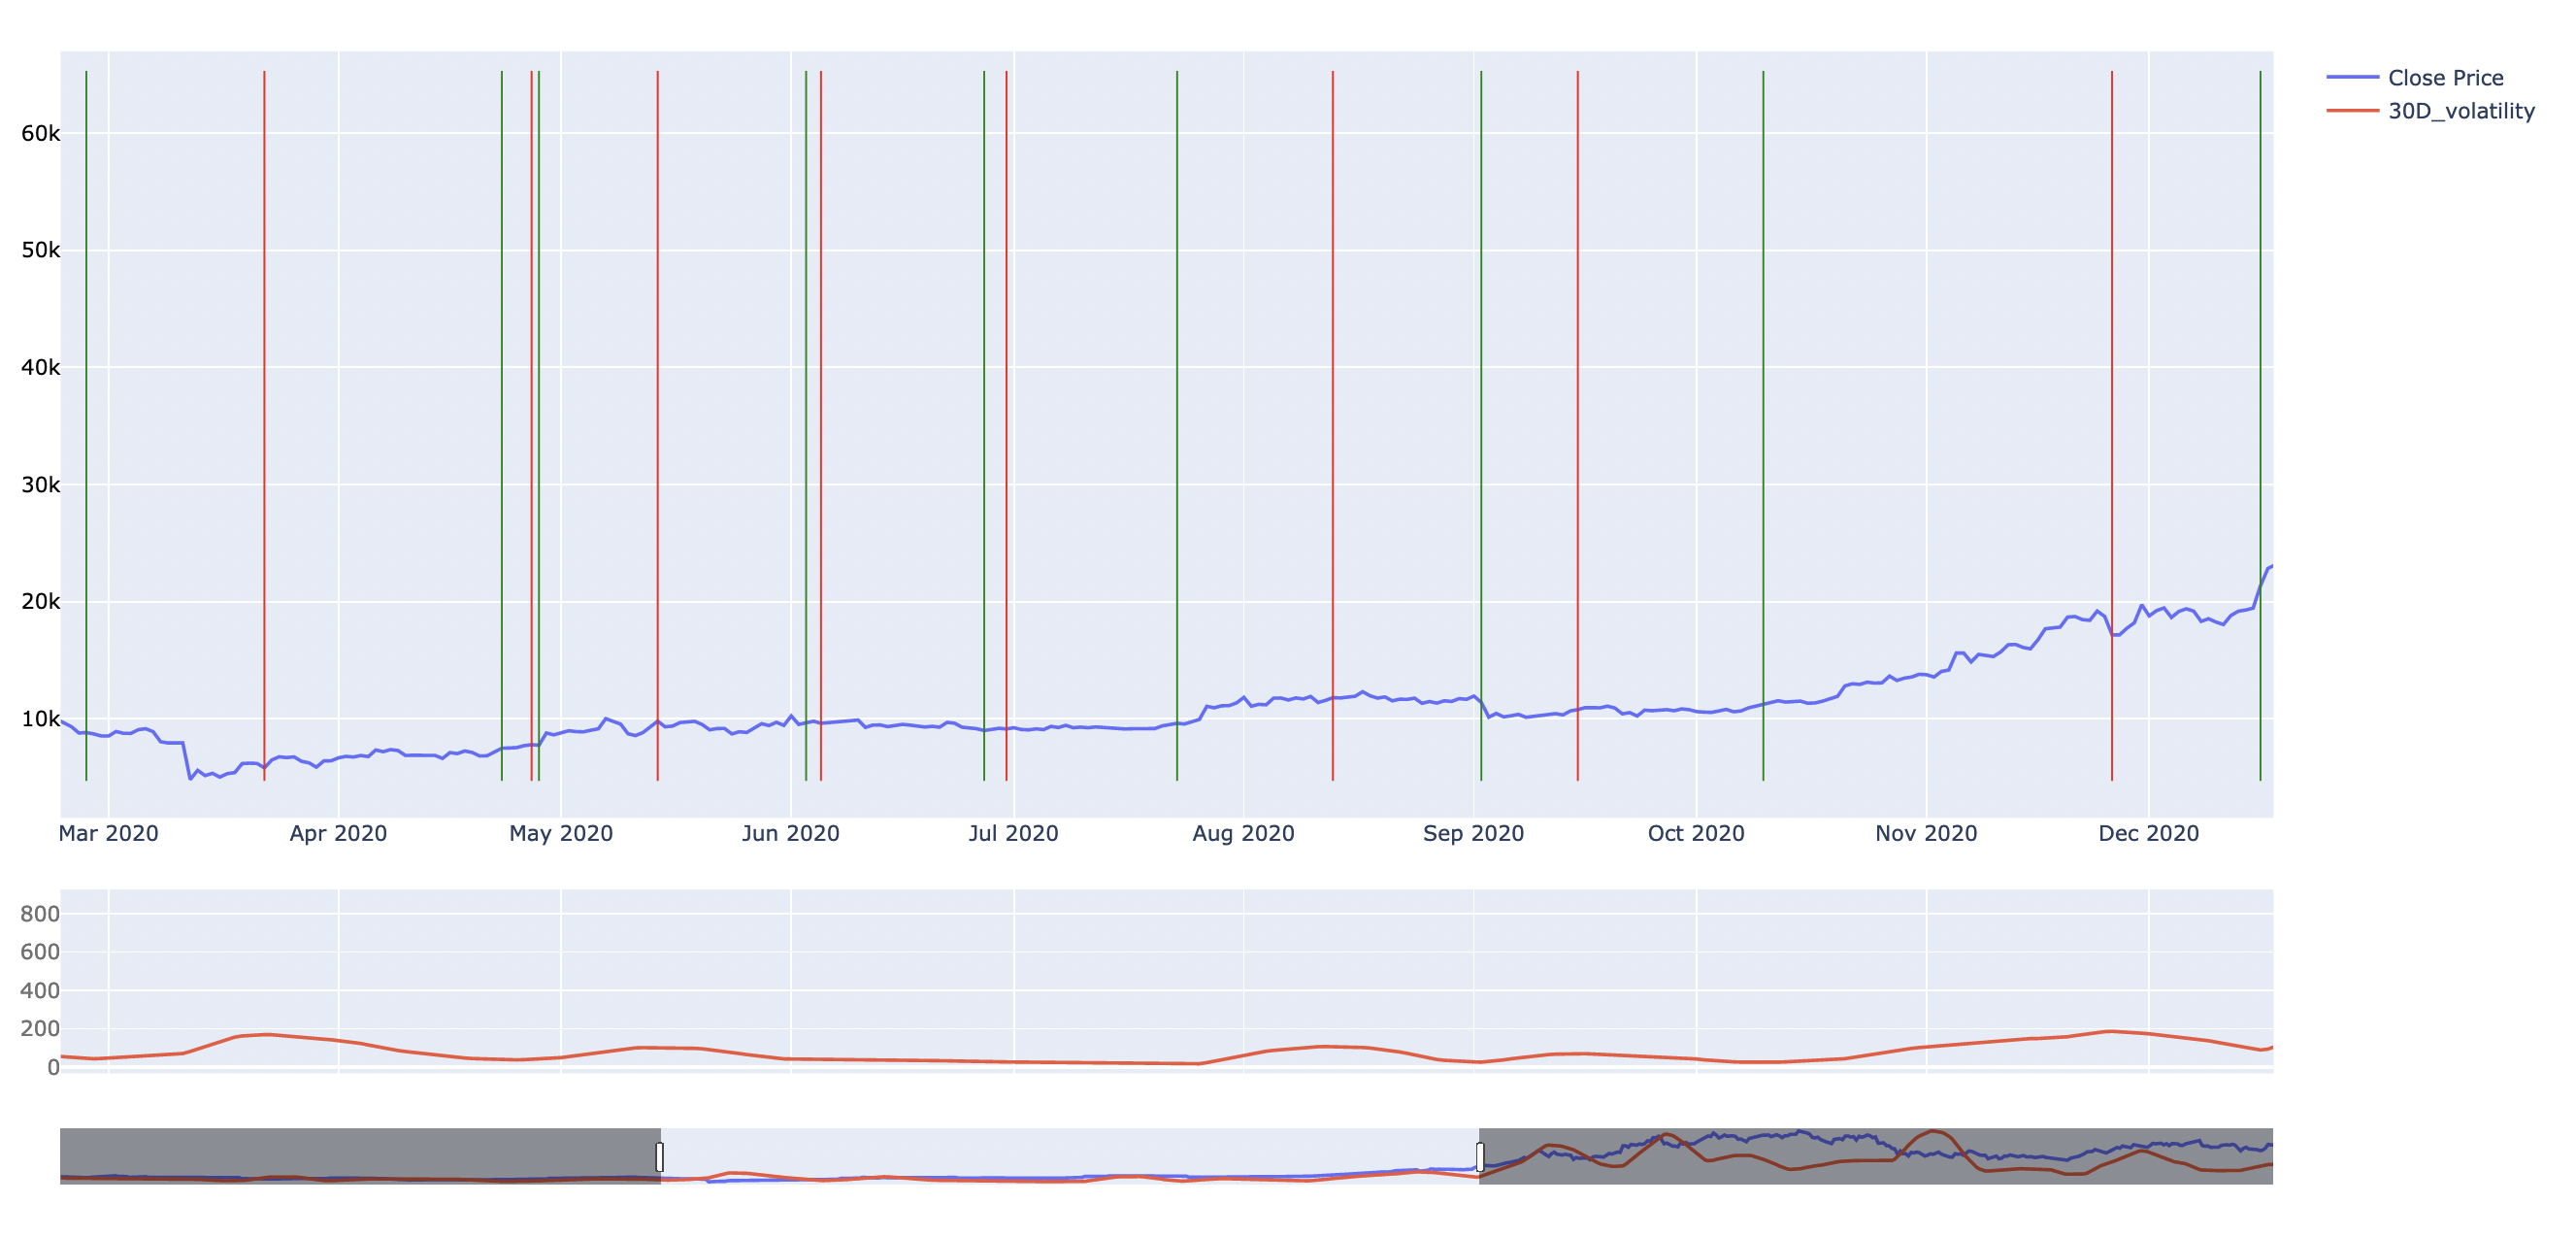
Four-year cycle, smart money chart are some ways people divide the market to see trends. I apply standard deviation on the daily close data of bitcoin to obtain its volatility. Then I would had applied 30-day moving average, following it with a gaussian filter with a sigma of 3 to smoothen it out. But this will cause a look-ahead bias. To prevent this, I apply gaussian filter to the 30 day moving average without giving access to the next day’s data and obtain a completely unbiased trend chart:
 </img>
The trend line is at the bottom. Every time the trend line changes direction, a vertical line is drawn in the price chart. Through this approach, anything that lies between 2 lines is part of that trend. If the trend is smaller than 3 days, I discard it. The obtained trend groups are:
| start | end | name |
|---|---|---|
| 02-28-2020 | 03-23-2020 | corona_dump |
| 03-23-2020 | 04-24-2020 | corona_recovery |
| 04-29-2020 | 05-15-2020 | further_recovery |
| 05-15-2020 | 06-04-2020 | 9k_accumulation |
| 06-06-2020 | 06-28-2020 | further_9k_accumulation |
| 07-01-2020 | 07-24-2020 | final_9k_accumulation |
| 07-24-2020 | 08-14-2020 | initial_takeoff |
| 08-14-2020 | 09-03-2020 | 12k_dump |
| 09-03-2020 | 09-16-2020 | 10k_accumulation |
| 09-16-2020 | 10-11-2020 | 10k_accumulation_2 |
| 10-11-2020 | 11-27-2020 | lift_off |
I gave each column names manually for clarity. Bitcoin moves similarly between these points in the medium term. Price reversals similarly take place. Volatility and the direction mostly stay the same. In the long term, all of this is part of a more significant upside trend.
Simple Test
A new trend is created when something different happens. So, if the group was created due to the price going up, we go long. If it was created due to a price falling, we go short. To do this, we calculate the percentage change in price from 4 days to the start of a trend to the start. If it is positive, we go long. If it is negative, we go short.
| Trend Name | 4 Days before Trend start date | Price 4 days before start | Trend start date | Price during the Trend start | % change at start | Date at end of Trend | Price at end of Trend | Return if held | Strategy Trade Direction | Strategy Return |
|---|---|---|---|---|---|---|---|---|---|---|
| corona_dump | 2020-02-24 | 9970.09 | 2020-02-28 | 8801.27 | -11.72 | 2020-03-23 | 5868 | -33.33 | SHORT | 33.33 |
| corona_recovery | 2020-03-19 | 5449 | 2020-03-23 | 5868 | 7.69 | 2020-04-24 | 7506.94 | 27.93 | LONG | 27.93 |
| further_recovery | 2020-04-25 | 7491.2 | 2020-04-29 | 7762.77 | 3.63 | 2020-05-15 | 9773.26 | 25.9 | LONG | 25.9 |
| 9k_accumulation | 2020-05-11 | 8756.57 | 2020-05-15 | 9773.26 | 11.61 | 2020-06-04 | 9645.99 | -1.3 | LONG | -1.3 |
| further_9k_accumulation | 2020-06-02 | 10250.1 | 2020-06-06 | 9573.96 | -6.6 | 2020-06-28 | 8992.81 | -6.07 | SHORT | 6.07 |
| final_9k_accumulation | 2020-06-27 | 9131.59 | 2020-07-01 | 9119.09 | -0.14 | 2020-07-24 | 9608 | 5.36 | SHORT | -5.36 |
| initial_takeoff | 2020-07-20 | 9222.54 | 2020-07-24 | 9608 | 4.18 | 2020-08-14 | 11837.12 | 23.2 | LONG | 23.2 |
| 12k_dump | 2020-08-10 | 11720.58 | 2020-08-14 | 11837.12 | 0.99 | 2020-09-03 | 11394.71 | -3.74 | LONG | -3.74 |
| 10k_accumulation | 2020-08-30 | 11488.97 | 2020-09-03 | 11394.71 | -0.82 | 2020-09-16 | 10745.76 | -5.7 | SHORT | 5.7 |
| 10k_accumulation_2 | 2020-09-12 | 10380.98 | 2020-09-16 | 10745.76 | 3.51 | 2020-10-11 | 11309.66 | 5.25 | LONG | 5.25 |
| lift_off | 2020-10-07 | 10585.37 | 2020-10-11 | 11309.66 | 6.84 | 2020-11-27 | 17135.02 | 51.51 | LONG | 51.51 |
As you can see, strategy goes long when “% change at start” is positive and short when negative. While trading this way, the direction of 8/11 trend based trades was right. The wrong ones are slightly wrong while the right ones are bigly right. It returns 325% overall while buy and hold would had returned 87%. This is a very good strategy except during the accumulation trends.
It works this good because bitcoin moves similarly. Some can claim a look-ahead bias in creating this. I can claim I formed the method months ago looking at the 2019 data. But, the more powerful argument against the look-ahead bias will be the test of time, which I am confident this will pass until something fundamentally changes.
Advanced test
In supervised Machine Learning, there is a concept of training set and test set. You use the training set to train your system. In test set, you test it. I don’t use ML in these test. But I use a similar concepts for the test here. I define a general set of rules. Then I use the duration between 3 days before creating the group to the group’s start (which I refer to as training set) to optimize the rules. Then I apply those rules in the upcoming trend - the test set.
For the test here, I consider a worse than realistic fee of 0.075% per trade and worse than realistic slippage - 0.01% in both directions. If leverage is used, I consider funding of -0.01% every 8 hours. Furthermore, for a leverage n, I multiply slippage, funding, and fee by the same n to be realistic.
For this strategy, I use 10 min OHLCV data constructed from the bitmex trade data along with:
- percentage_large: The % of trade volume of trades whose size is bigger than 10 BTC out of trades which are bigger than 500$
- percentage_large_reversal: The difference between the 30 mins percentage_large mean and 240 mins percentage_large mean
- buy_percentage_large: 30 mins moving average of the percentage of buy trades bigger than 10 BTC
- macd: difference between the 26 and 12 candle MA on 10 min OHLCV data
- rsi: 10 Min RSI on close price
Rules:
Here pnl is the current pnl % for the open position. loss_cap_par, long_rsi_par, short_rsi_par, percentage_large_reversal_par, percentage_large_par, buy_percentage_large_long_par, buy_percentage_large_short_par, macd_long_par, sell_percentage_large_par, macd_short_par are parameters whose value will be selected from the test set (3 days before the creation of the group to the start) out of the given allowed values:
- percentage_large_par: [0.12,0.18,0.24,0.3,0.35,0.4,0.45,0.5,0.6,0.7]
- percentage_large_reversal_par: [0,0.001,0.005,0.01,0.02,0.03,0.06,0.12,0.24,0.5]
- loss_cap_par: [-0.5,-1,-2,-3]
- buy_percentage_large_long_par: [0.1,0.2,0.3,0.4,0.5,0.6,0.7,0.8,0.9]
- buy_percentage_large_short_par: [0,0.01,0.05,0.1,0.15,0.2,0.3,0.5]
- macd_long_par: [-80,-60,-40,-30,-20,0,10]
- macd_short_par: [-60,-50,-40,-30,-20,-10,0]
- rsi_long_par: [75,80,85,90]
- rsi_short_par: [5,10,15,20,25,30,35]
I tried not to make this too complicated. I created this method because I have found that big trades are sometimes indicative of future movements. RSI and loss_cap_par are used to focus on bitcoin’s similar reversals. percentage_large_reversal, percentage_large, buy_percentage_large, and macd is used to focus on activities following identical trading patterns at similar times. Again, the test against cheating in rule creation will be the test of time. The rules I used is just one. I am confident you can similarly optimize other different strategies (because I have done it).
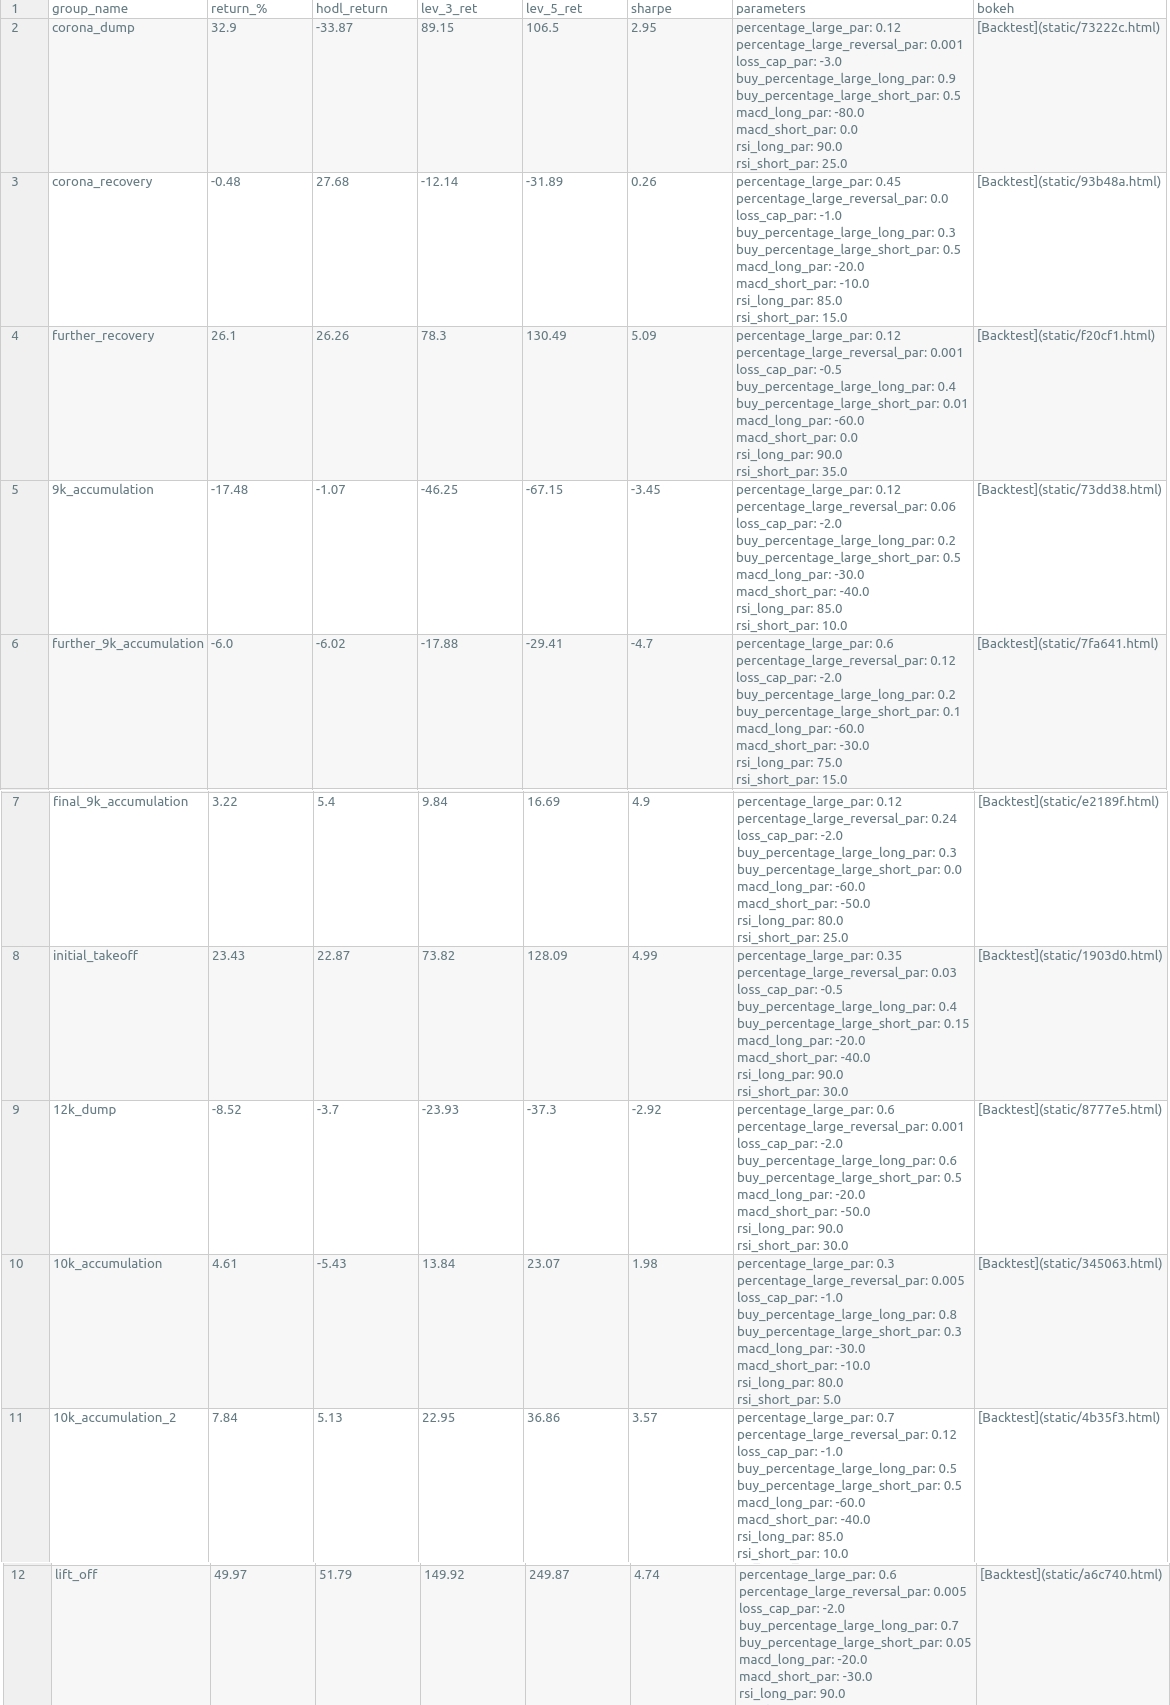
I run 800 random iterations with random parameters to find the best performing parameter in the training set. Then I use that parameter in the test set whose result is below:
| group_name | return_% | hodl_return | lev_3_ret | lev_5_ret | sharpe | Backtest |
|---|---|---|---|---|---|---|
| corona_dump | 32.9 | -33.87 | 89.15 | 106.5 | 2.95 | Backtest |
| corona_recovery | -0.48 | 27.68 | -12.14 | -31.89 | 0.26 | Backtest |
| further_recovery | 26.1 | 26.26 | 78.3 | 130.49 | 5.09 | Backtest |
| 9k_accumulation | -17.48 | -1.07 | -46.25 | -67.15 | -3.45 | Backtest |
| further_9k_accumulation | -6 | -6.02 | -17.88 | -29.41 | -4.7 | Backtest |
| final_9k_accumulation | 3.22 | 5.4 | 9.84 | 16.69 | 4.9 | Backtest |
| initial_takeoff | 23.43 | 22.87 | 73.82 | 128.09 | 4.99 | Backtest |
| 12k_dump | -8.52 | -3.7 | -23.93 | -37.3 | -2.92 | Backtest |
| 10k_accumulation | 4.61 | -5.43 | 13.84 | 23.07 | 1.98 | Backtest |
| 10k_accumulation_2 | 7.84 | 5.13 | 22.95 | 36.86 | 3.57 | Backtest |
| lift_off | 49.97 | 51.79 | 149.92 | 249.87 | 4.74 | Backtest |
And the best parameters for each detected from the training set here. Click on the “Backtest” on each backtests row to see the trading better. In each chart, green refers to buying and red selling. How it learns to trade using just grid search is quite impressive. In most trends, there is a lot of trades. But just buying and holding had been the best move from October 9 to 11. So the backtest of lift_off is just buy and hold. Similarly, 10k_accumulation is just short. Click on the link to know the details of each.
Overall, our strategy returns 155% while buy and hold returns 86%. A leverage of 3 increases the return to 564%. A leverage of 5 increases it to 639%. Mathematically and computationally speaking, all these are a fairly simple system. Beating buy and hold in a time like this isn’t usually easy. But, this system did it with a trading logic that can be heavily improved and optimized to shoot the return to thousands of percentage with a better sharpe ratio.
The good return shows that the movement is similar as we are using the best parameters found in the test set in the training set. Returns are not the only point I want to reflect on in this post. The heatmap below is:
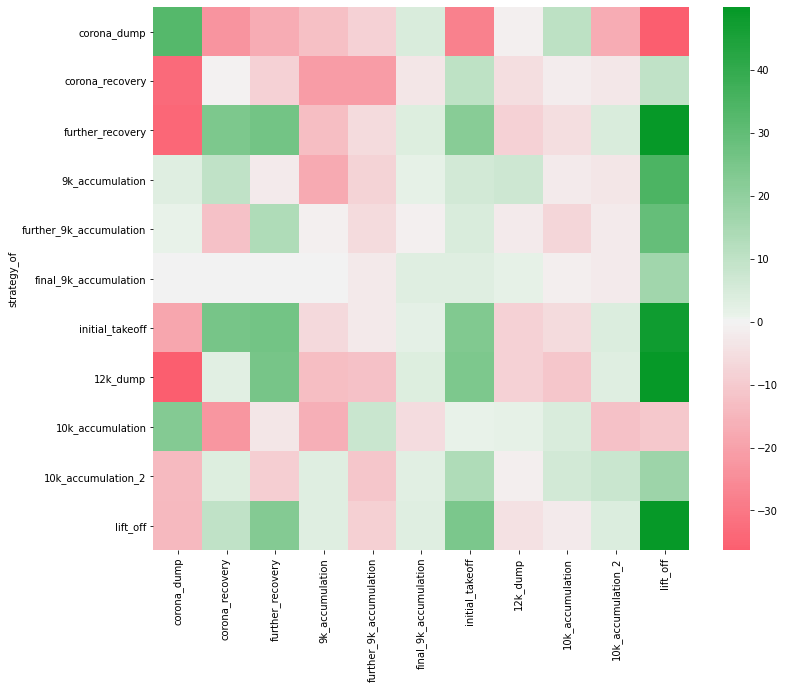
Look at the chart vertically to see how another group’s parameter would have performed on that group. Look at it horizontally to how using those parameters would perform overall. Greener it is, the higher the return there. Redder, lower.
I look at it vertically to provide comment to some interesting ones.
-
During the corona dump, the parameter created from the 3 days before would do good. Bullish ones obviously do bad. But the accumulation ones hold.
-
In most accumulation trends, parameters for other accumulation trends do good.
-
In bullish trends, bullish parameters do good.
As seen here the parameters are widely different. Yet the ones trained for similar circumstance does similarly indiciating a similar movement. And there is a lot of continuity in the the trends indicating similar response to similar stimuli, similar reverse at similar trends for it to be profiting.
| pars_of | return |
|---|---|
| corona_dump | -70.36 |
| corona_recovery | -59.78 |
| further_recovery | 46.23 |
| 9k_accumulation | 24.99 |
| further_9k_accumulation | 12.13 |
| final_9k_accumulation | 18.73 |
| initial_takeoff | 96.15 |
| 12k_dump | 1.58 |
| 10k_accumulation | -34.41 |
| 10k_accumulation_2 | 15.79 |
| lift_off | 106.73 |
The table above shows how using parameters for one group would have performed when used in all others. If you don’t change parameters, none of the parameters would have returned as good as our strategy. But there are still some good parameters overall as the market is in a single upside trend since March. It shows that people with “bullish bias” (i would call it seeing the world as it is) would perform much better than bears who trade thinking of corona dump (-70% when the market went up 80%) or “1 month of accumulation” and will continue to until this long term trend stops - if it does. But one wouldn’t have access to bullish parameters in the past without being bullish af, which most bitcoiners are
All these returns in the table above are without leverage. Traders will use leverage, and leverage brings up return a lot when done properly, as shown in my strategy above. Thus, in this long-term trend, a leveraged bullish trader with consistently sound logic have and will continue to do good - until the long term direction changes. And an automated trader will perform better than most algos when he considers bullishness - completely or with hedges. Bears can do good in specific trends, but changing like that isn’t really possible for nearly all human traders. Don’t fight the trend.